
Two primary datasets are used for understanding precipitation in Utah: point-based (SNOTEL) and gridded (PRISM). Both are described below.
Snowpack Telemetry (SNOTEL)
Point-specific SNOTEL measurements, taken at higher elevations, provide key insights into Utah’s water supply. The Natural Resources Conservation Service publishes historical statewide and basin SNOTEL measurements on their website. For those interested in point-specific SNOTEL measurements, historical statewide and basin plots are available through the Natural Resources and Conservation Service’s website.
Parameter-elevation Regressions on Independent Slopes Model (PRISM)
Gridded precipitation data, on the other hand, such as PRISM is a more reliable indicator of spatially continuous precipitation in the state and in various hydrologic basins. Utilizing the PRISM dataset offers a spatially accurate estimate of regional precipitation that accounts for Utah’s complex mountain topography. Detailed information on PRISM modeling can be found at PRISM Group.
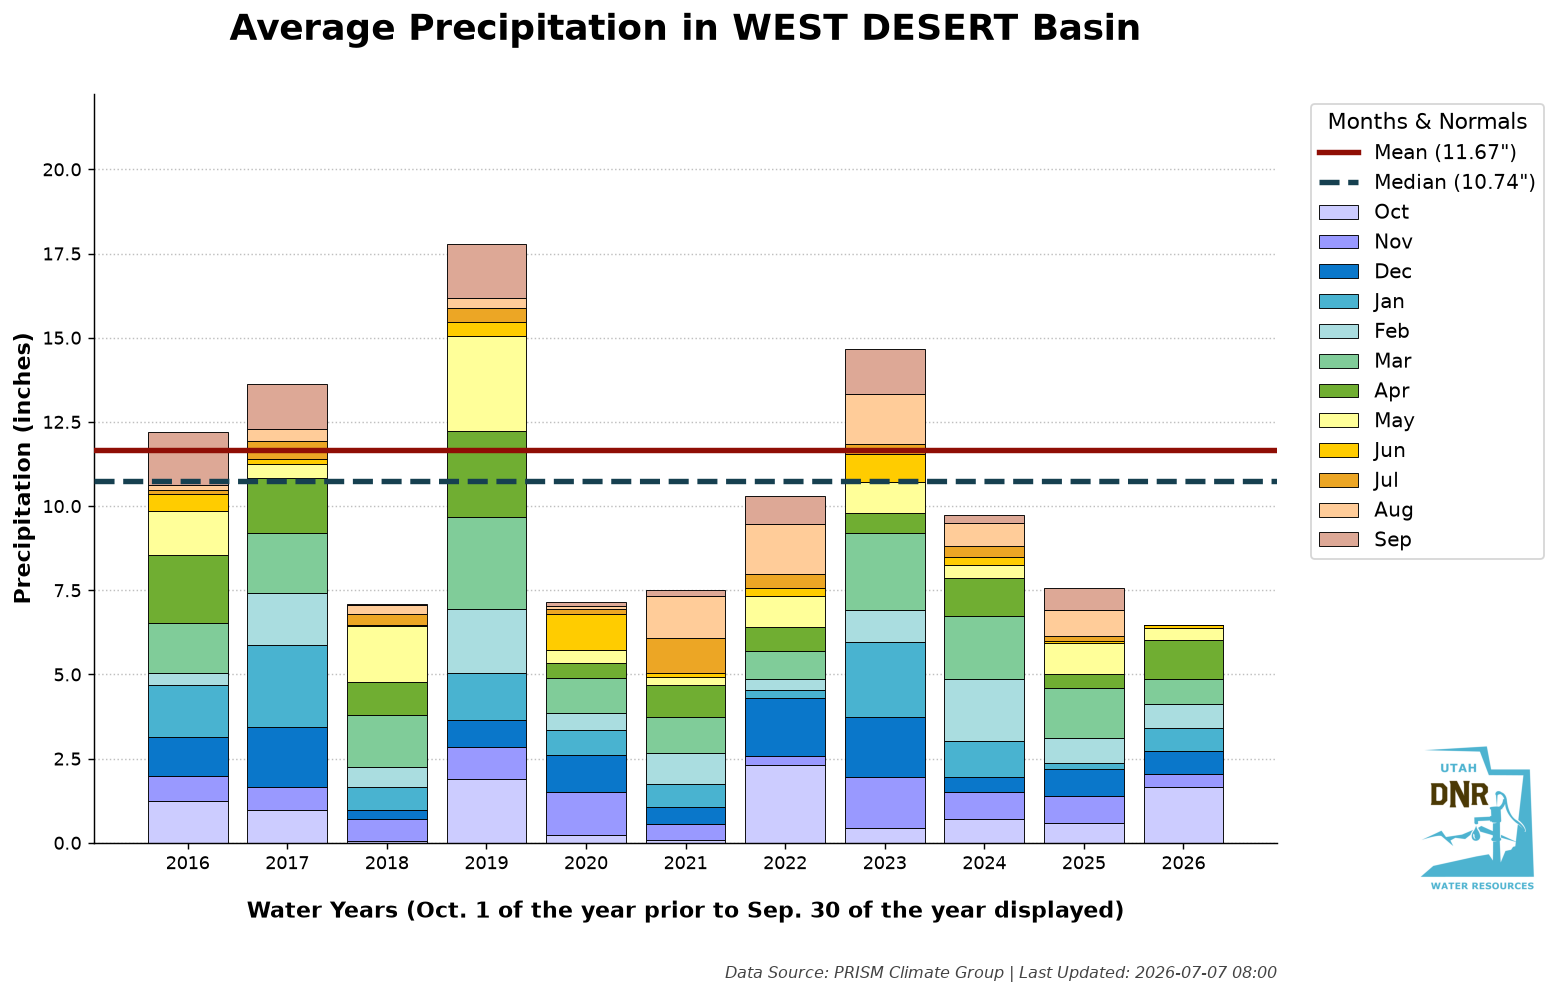
The following graphs provide monthly precipitation data across Utah and its major hydrologic basins, organized by Water Year starting on October 1 and ending on September 30. These visualizations use the PRISM climate dataset.
Note on Current Data: The precipitation graphs reflect the most current model runs available in the Google Earth Engine PRISM Catalog. The data catalog has a four-day delay. Therefore, the below graphs reflect totals accumulated four days ago.
Current Precipitation Graphs
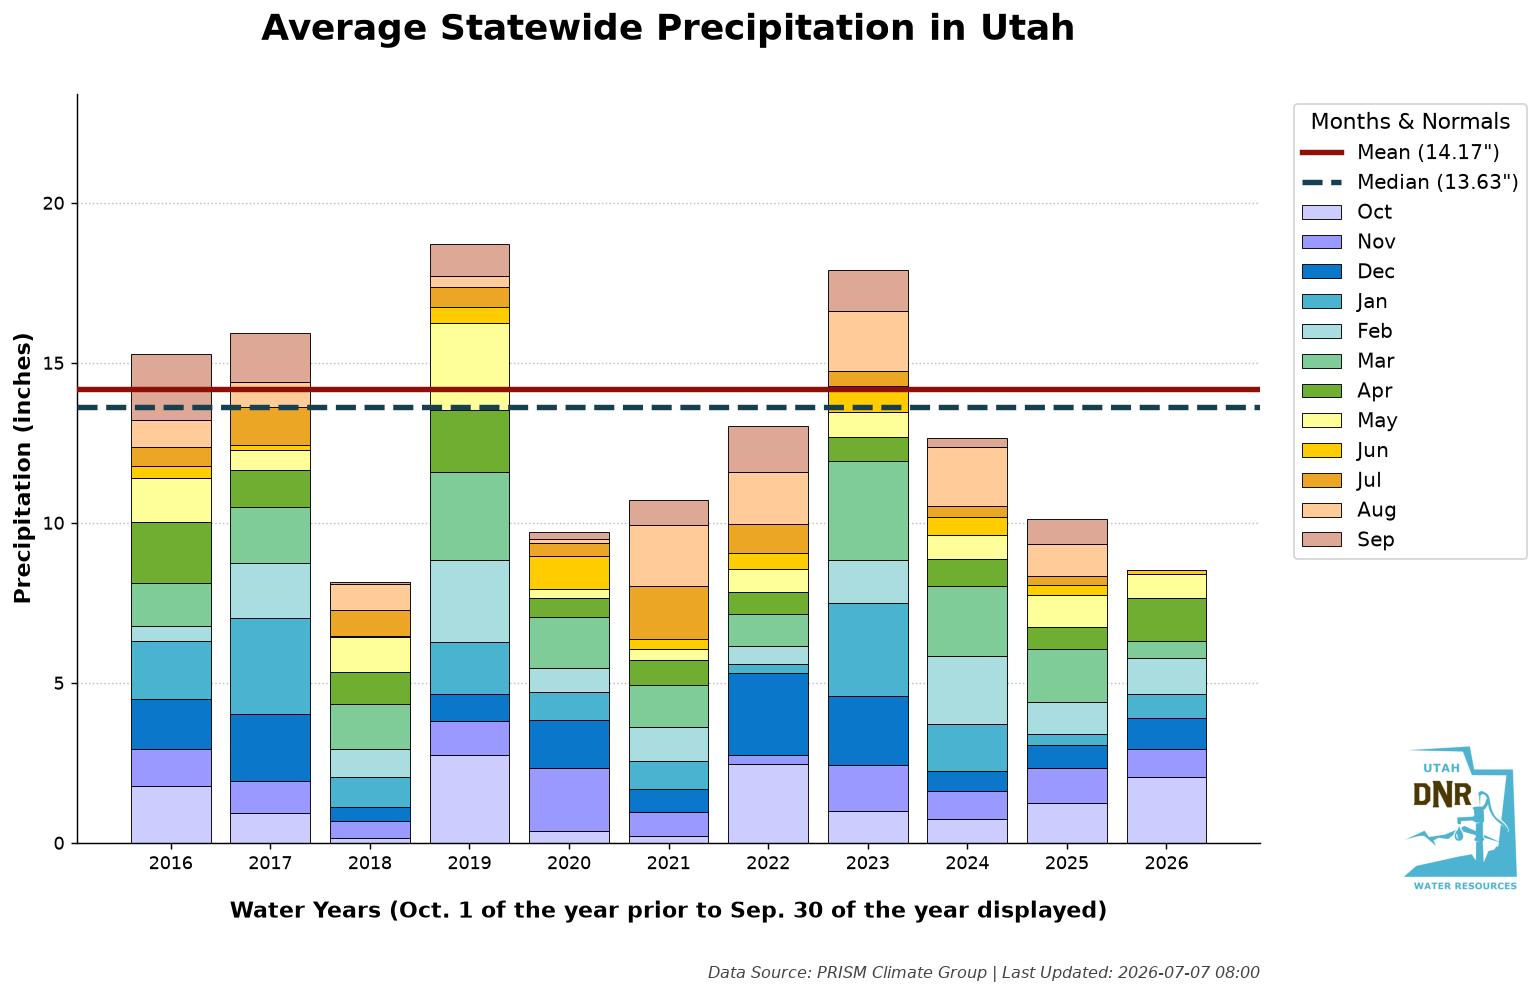
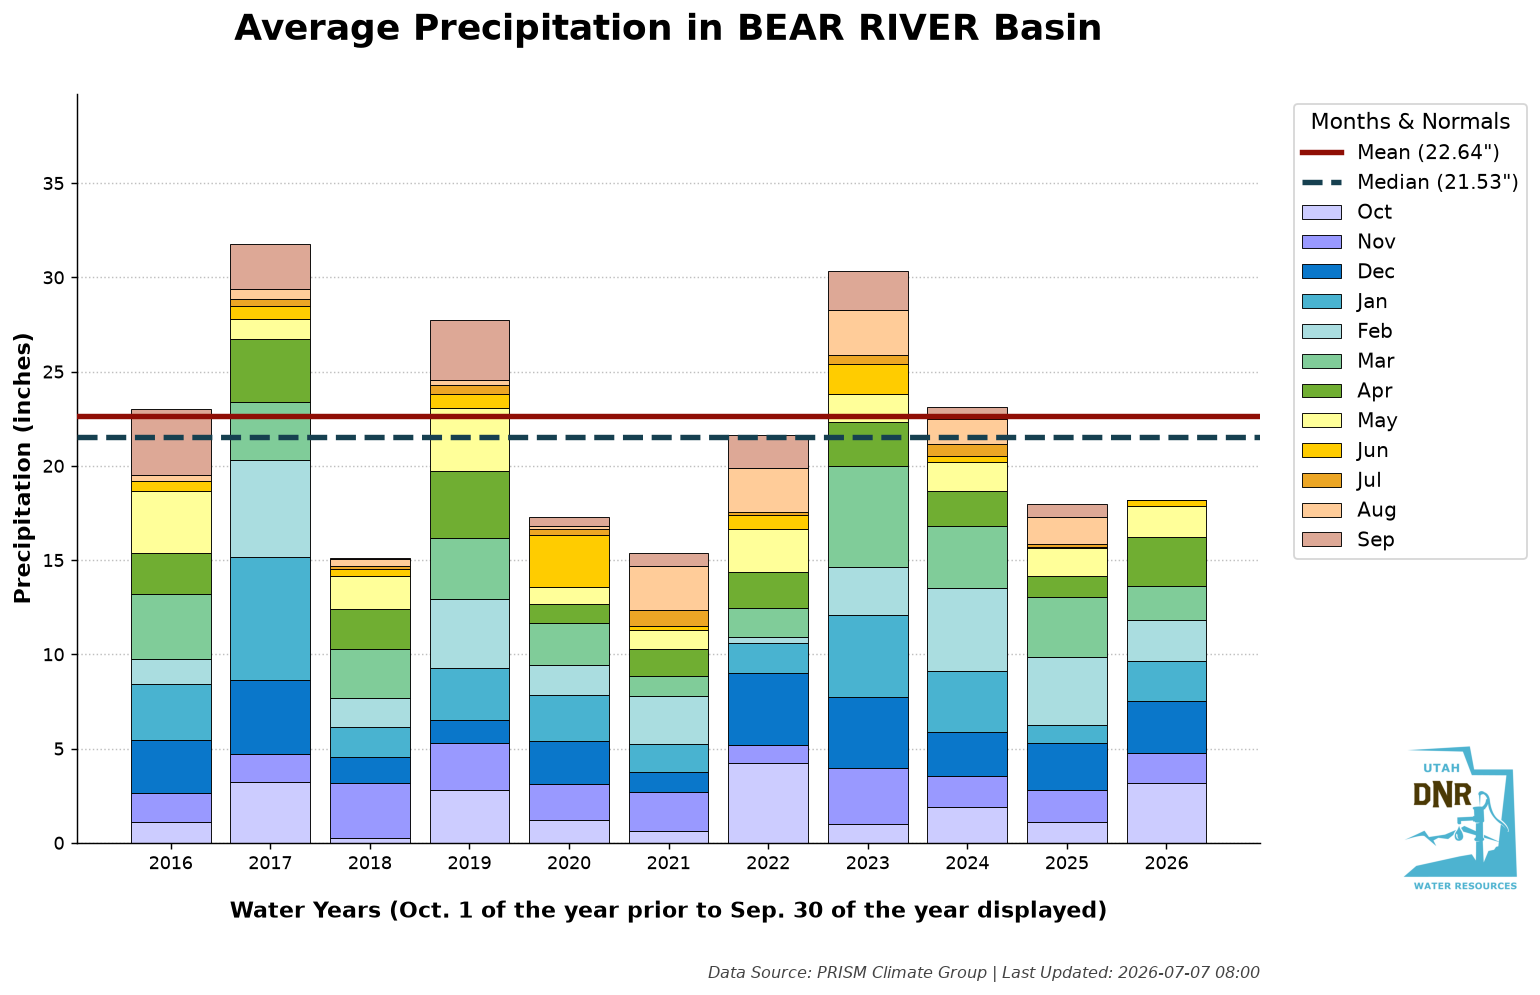
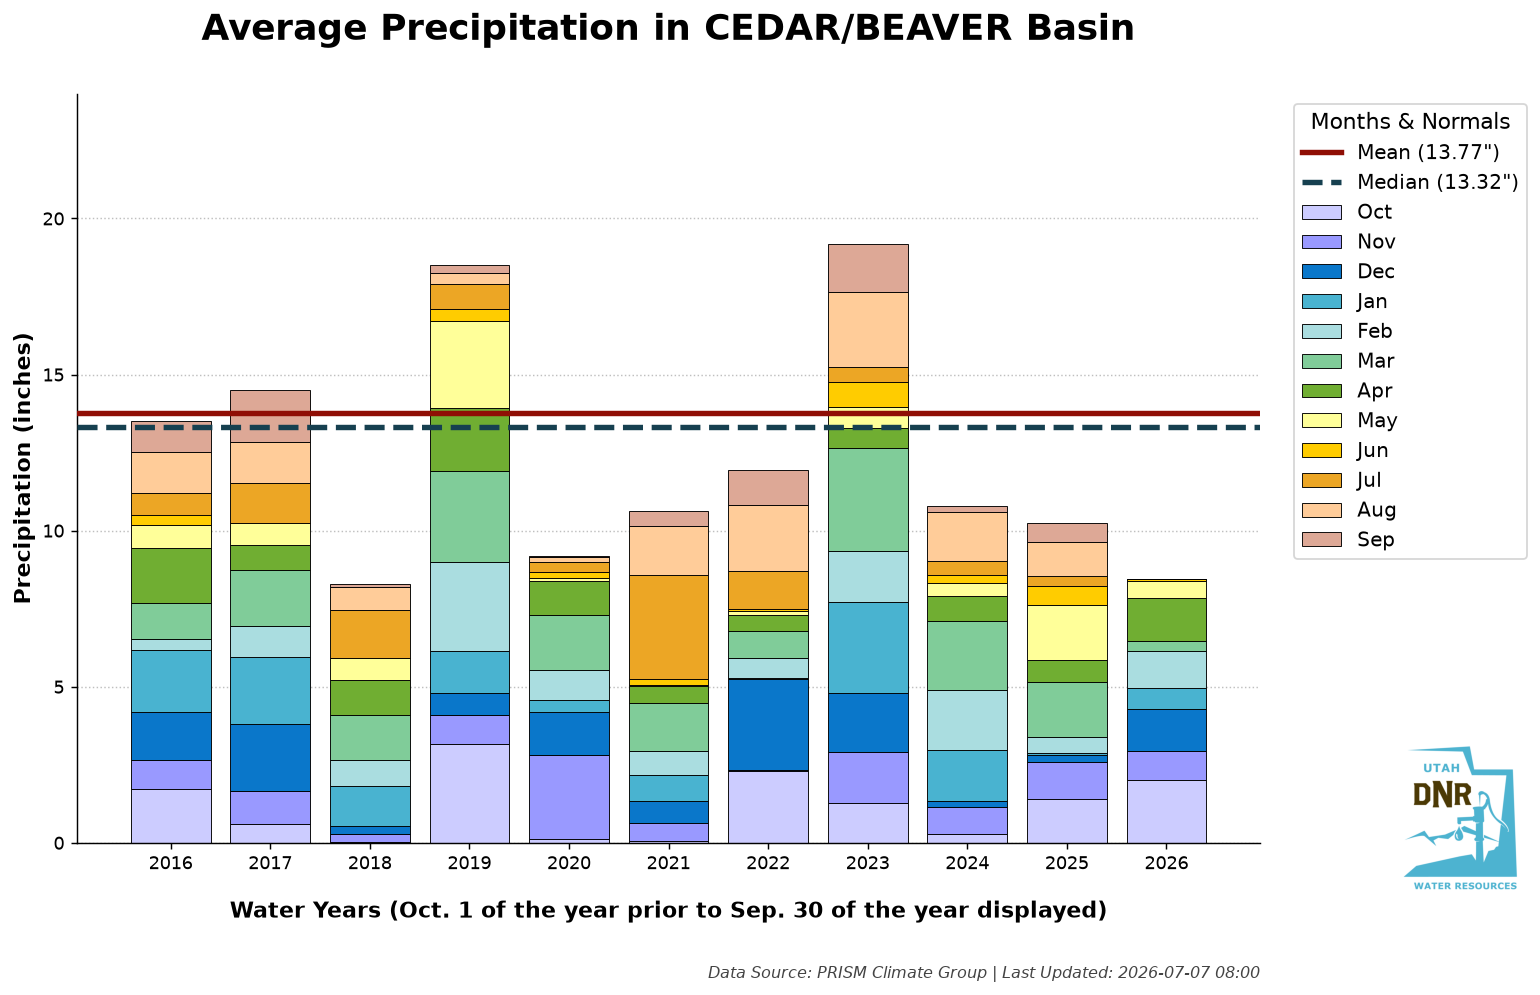
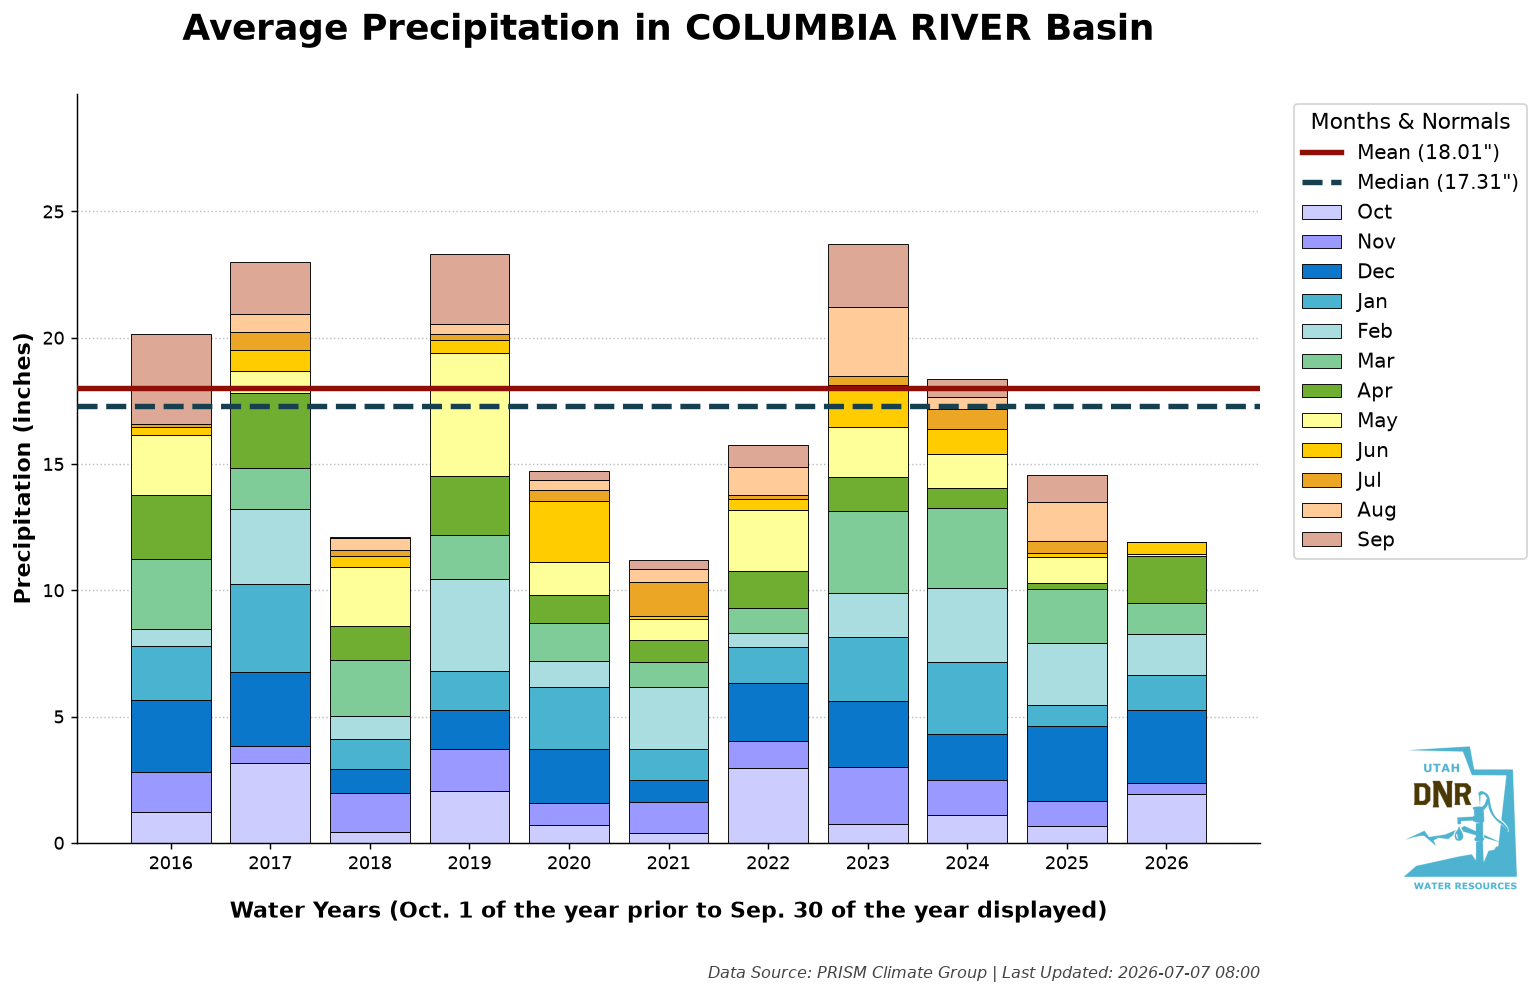
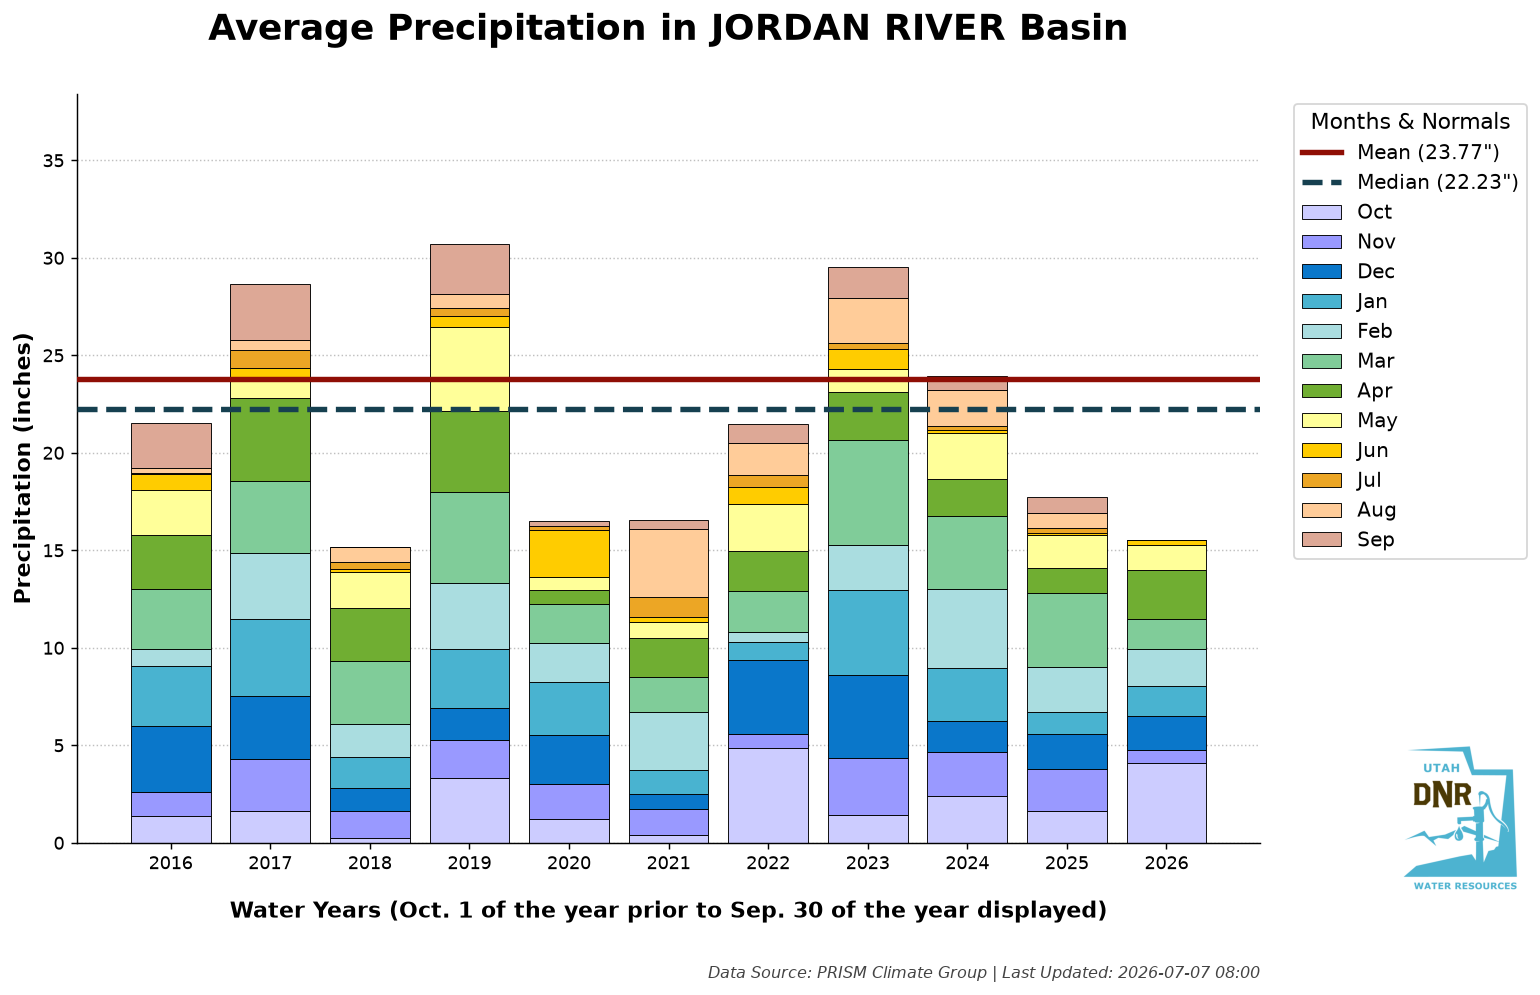
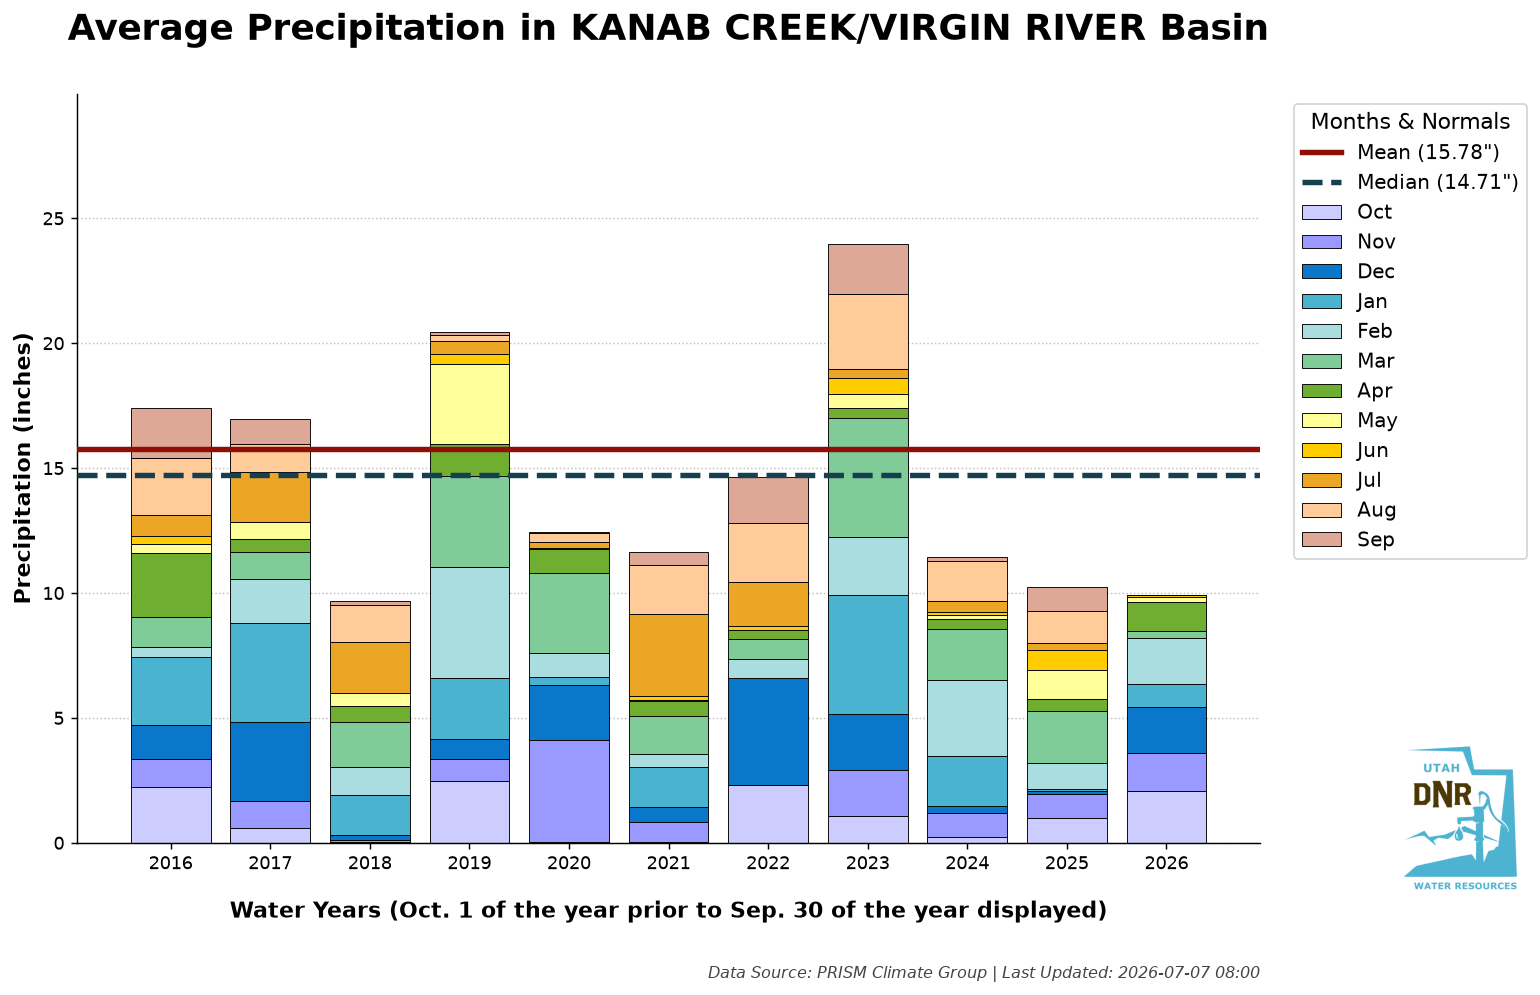
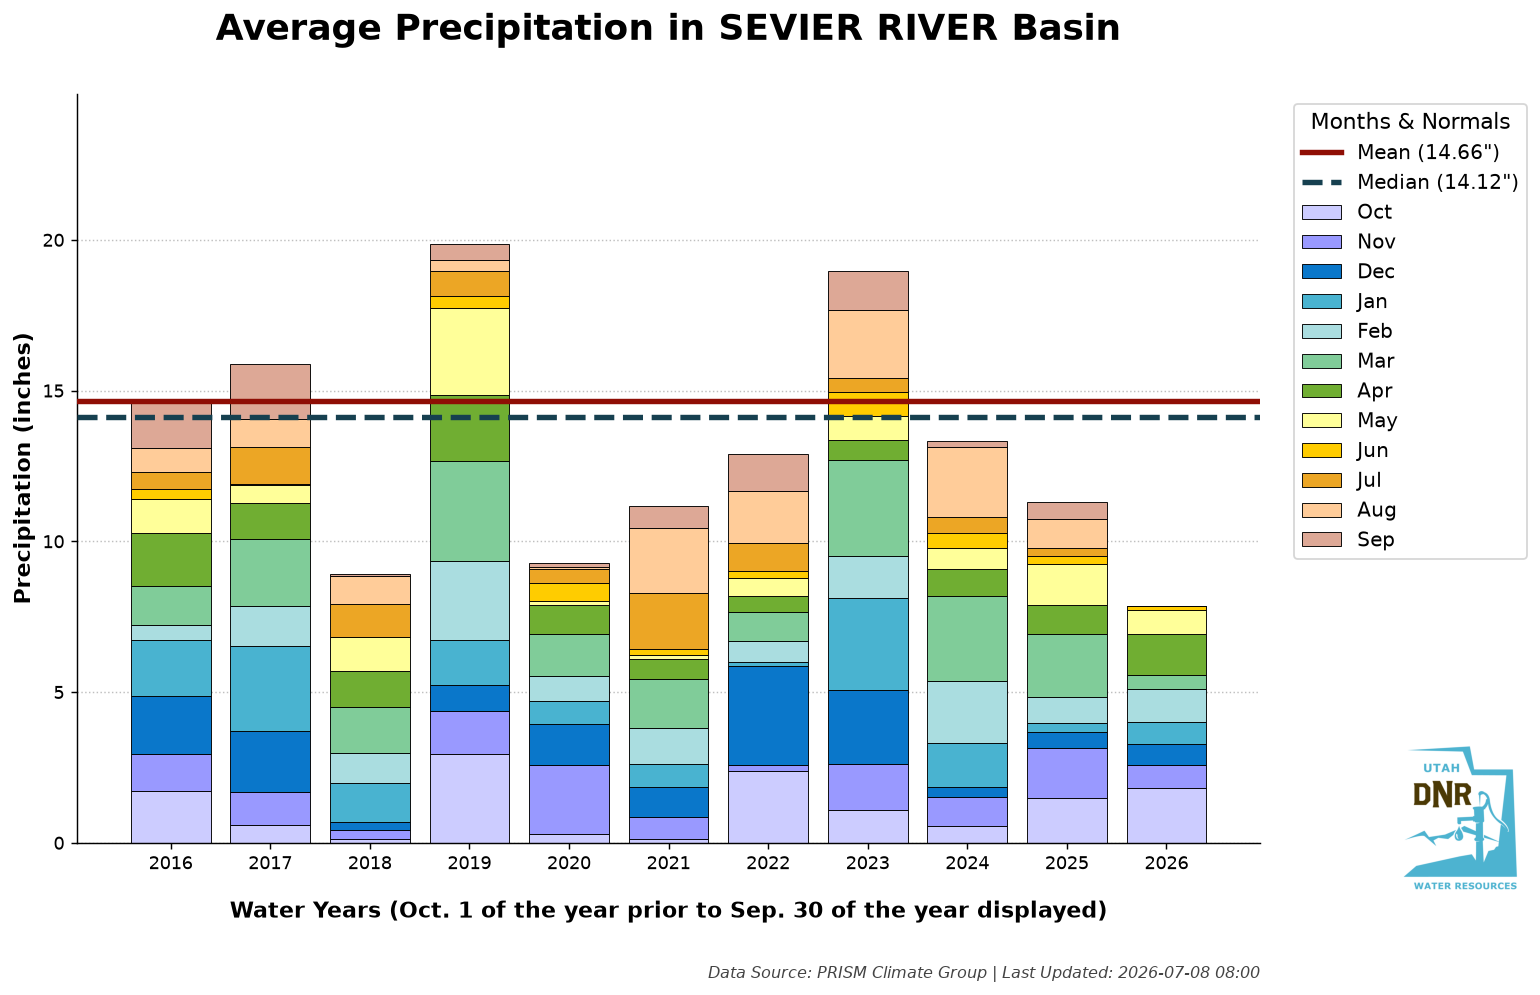
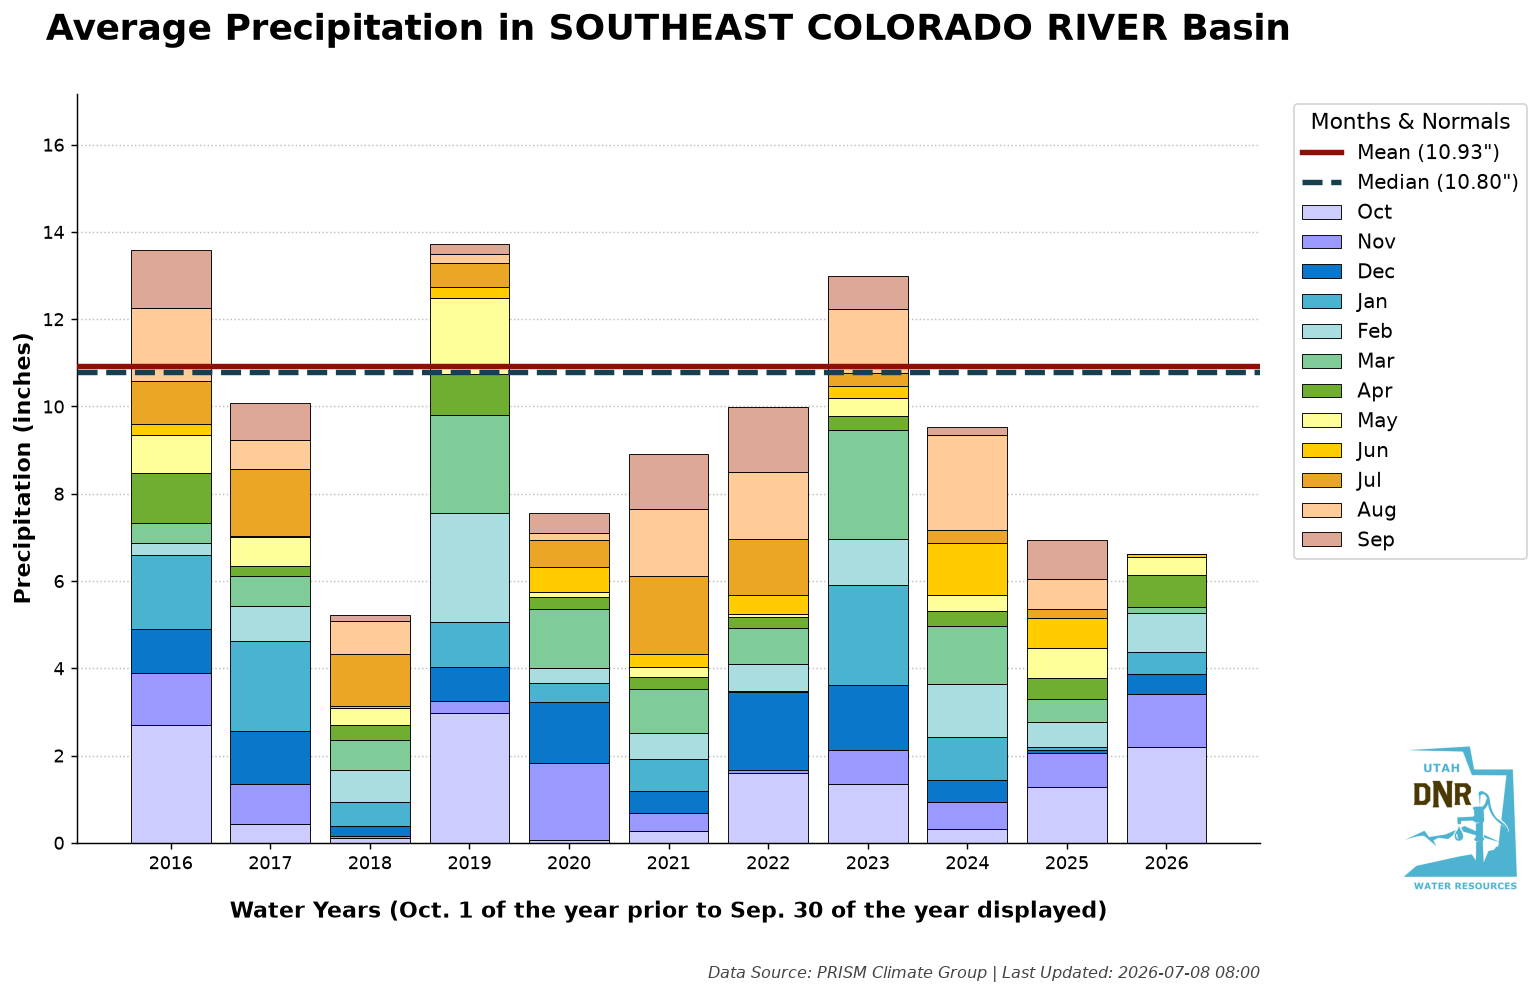
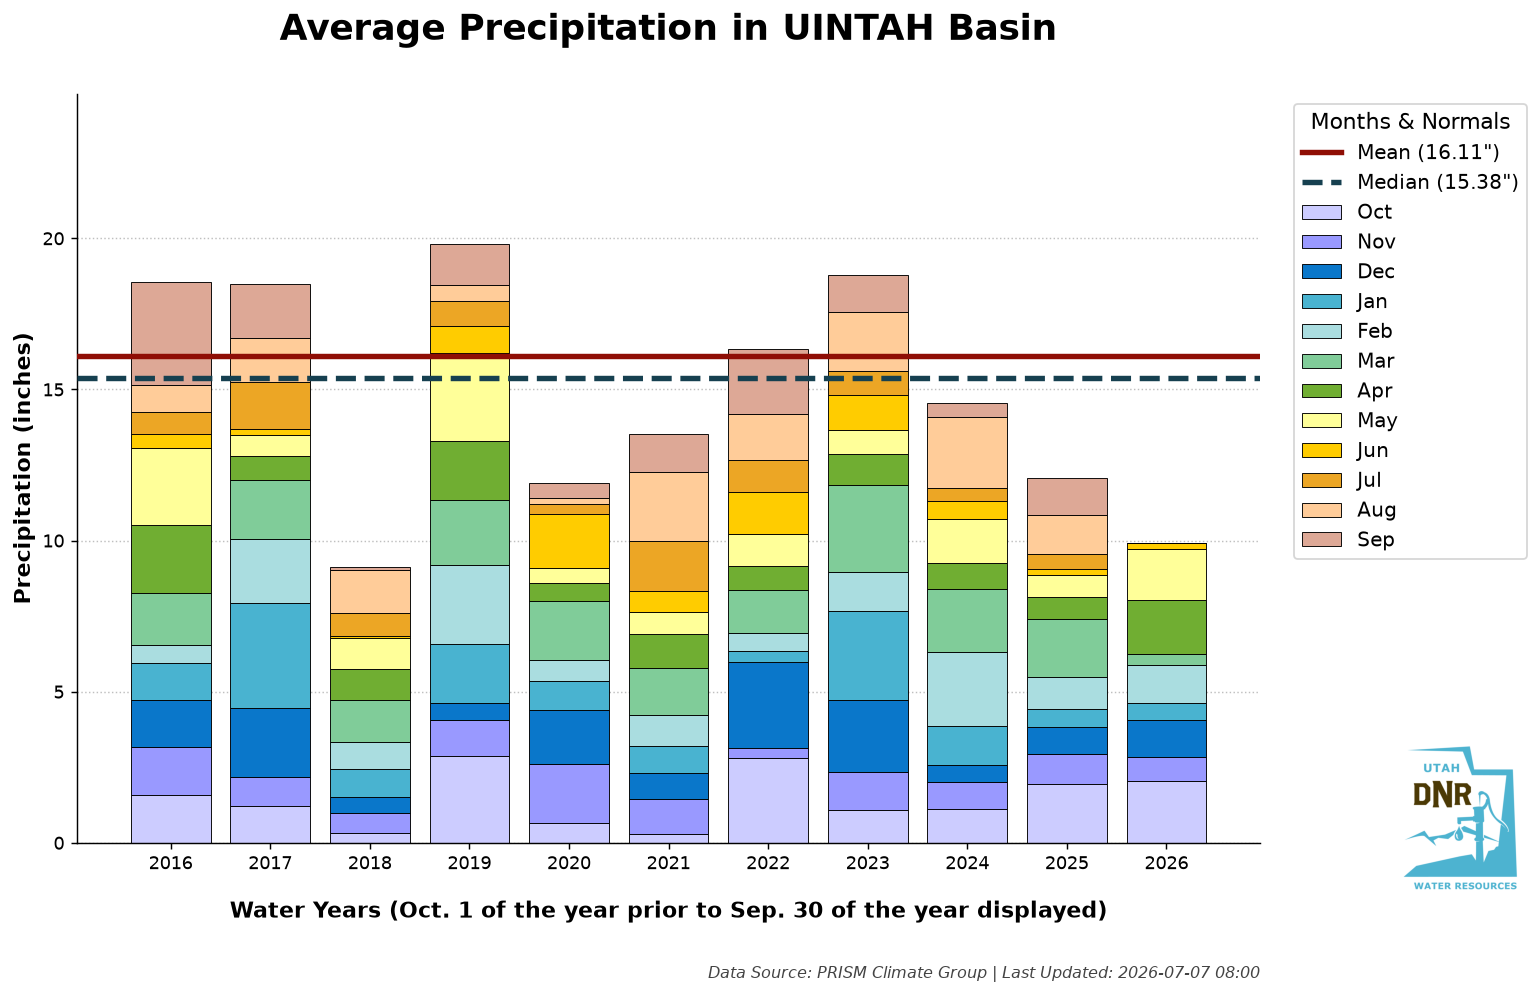
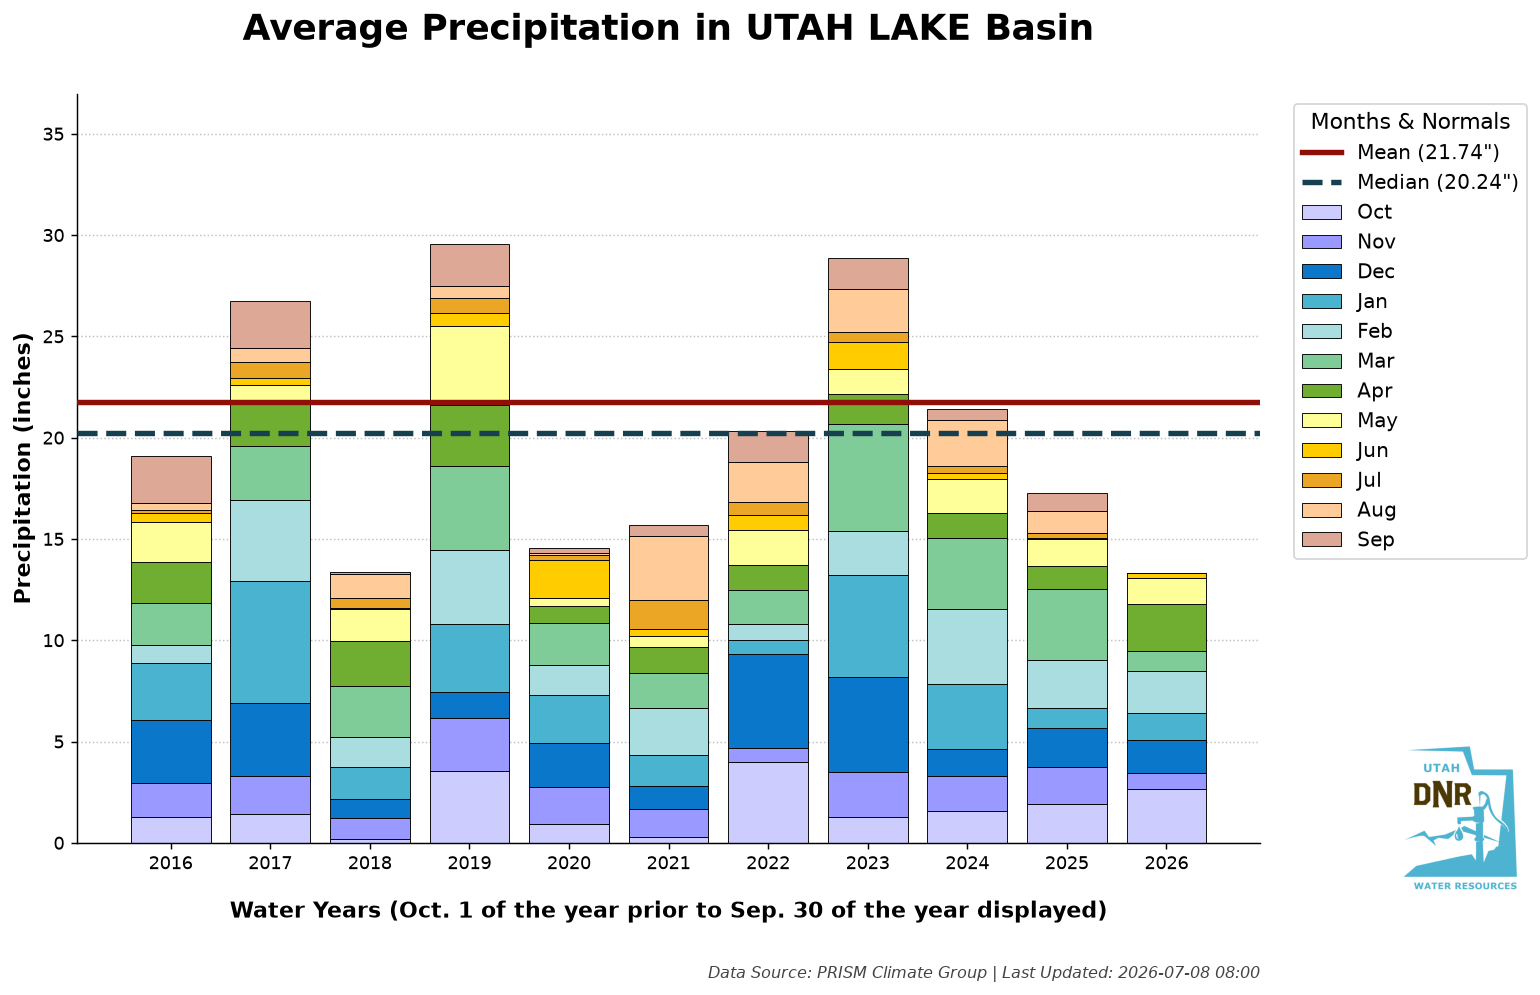
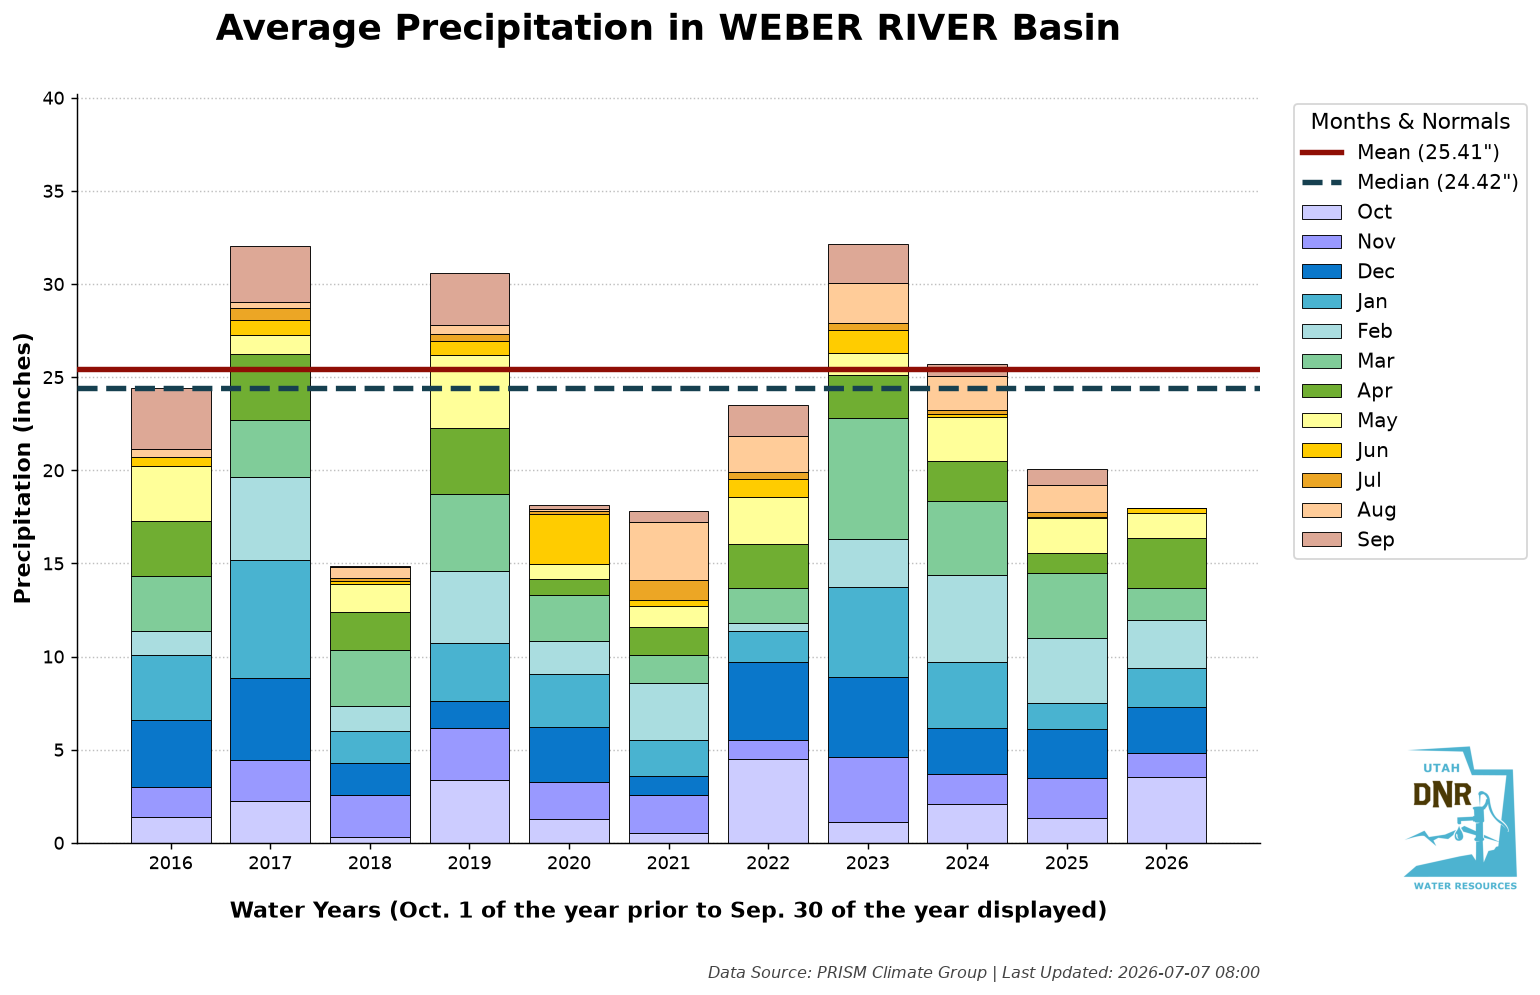
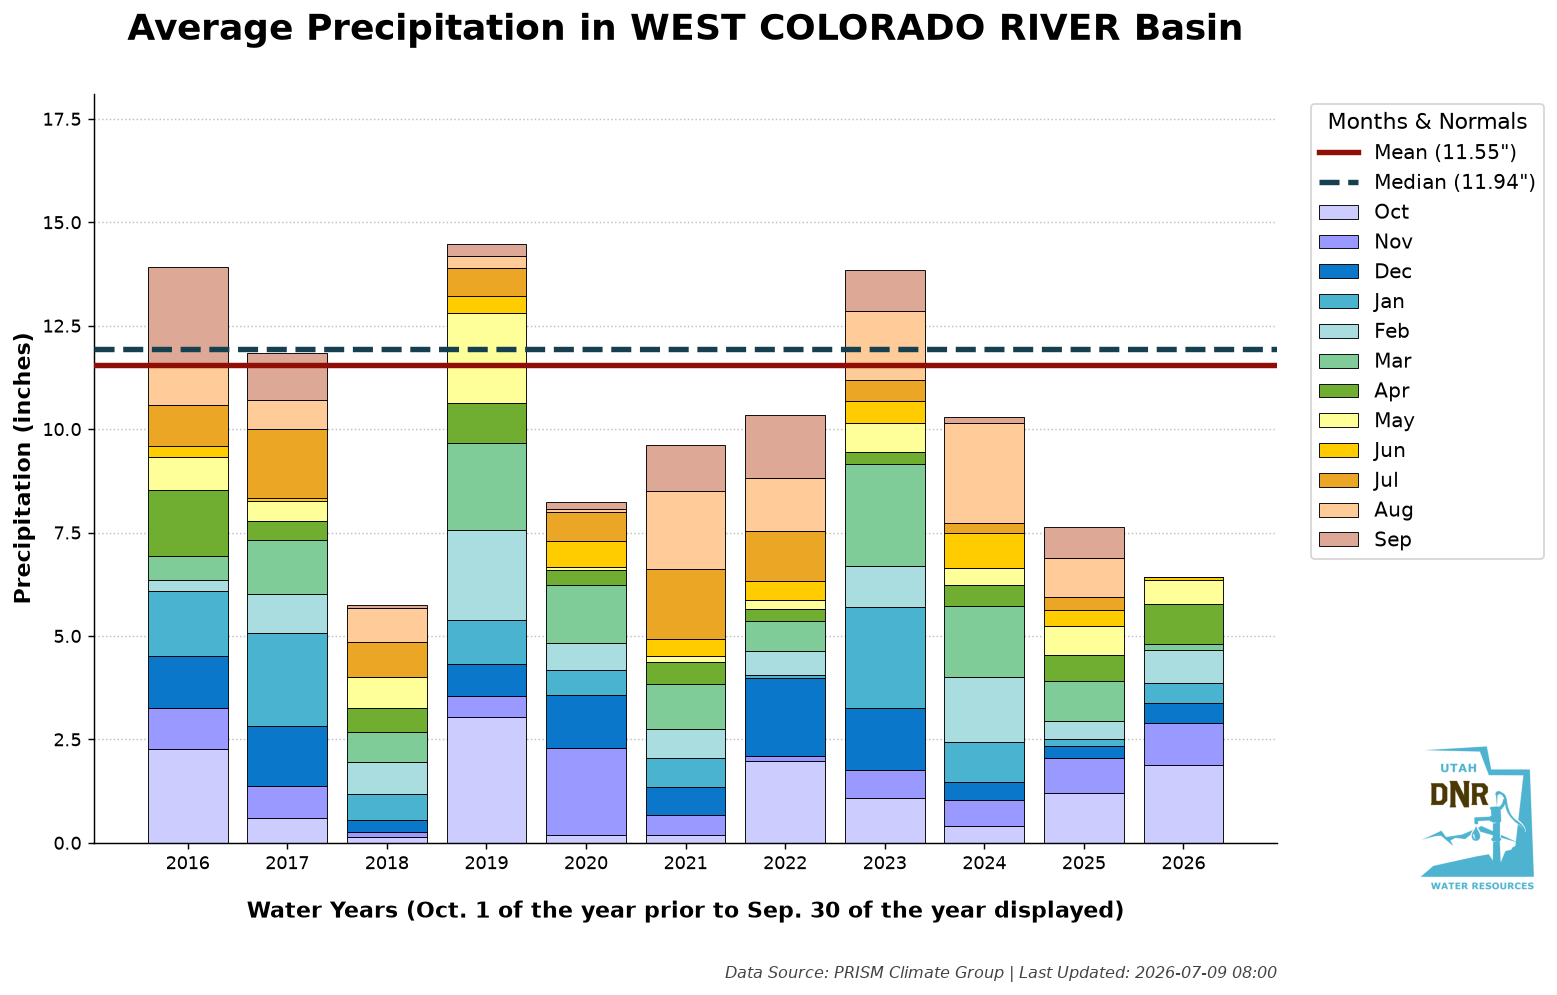
Precipitation Graph Archive
1990-2000 | 2000-2010 | 2010-2020 |