Water use reporting
Community planners monitor water use to observe trends and adjust their plans so that communities can thrive.
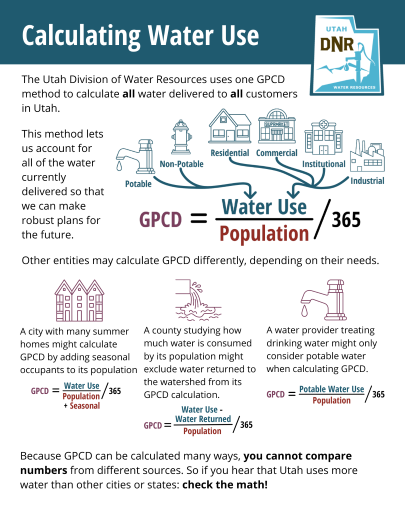
There isn’t a national standard for measuring and reporting water use. Gallons Per Capita per Day (GPCD) is a common metric, but it can be calculated in many ways. The Utah Division of Water Resources’ method of calculating GPCD accounts for all water delivered to all customers. This makes Utah’s water use look higher than other regions, many of which use another metric or calculate GPCD differently.
No method of calculating water use is good or bad – just different. Unfortunately, the varied methods used to report water use makes meaningful comparison of results difficult.
Utah leads the nation in comprehensive reporting
The division’s municipal and industrial water use reporting program is the only program in the nation that uses one method to calculate the amount of water delivered to customers for every public water system in the state. Utah includes all potable and non-potable (reuse and secondary) water by all users (residential, commercial, institutional, and industrial) in its GPCD.
The division sums the potable and non-potable water delivered to public water system customers and divides by the full-time population within the water system service area boundary. All water delivered to customers in a year is averaged over population and divided by the number of days in a year.
It seems straightforward, but it’s not. What is included in (or omitted from) ‘water use’ and ‘population’ can drastically change the resulting water use when reported in GPCD. Some places only report certain uses of water and/or exclude water that returns to the water system.
The division’s accounting method means Utah’s water use looks higher than other cities, regions or states. However, it strives to account for all water delivered to customers.
Population estimates
The division calculates GPCD by dividing water use by the population, then dividing by the number of days in a year. Because GPCD depends on population, how an entity calculates population affects water use reporting. Some entities calculate population by applying the average person per household to all residential units rather than using Census Bureau population estimates. The division uses Census Bureau estimated permanent resident population within a water provider service area boundary.
Tracking use is essential for planning
The division’s GPCD numbers are used to set goals and demonstrate accountability. Water systems that receive state funds for system improvements are required to account for water savings as a result of the investment. These numbers may be used to compare 2015 baseline water use to water use after improvements.
The division set regional water conservation goals with 2015 water use as the baseline. The division’s water use GPCD will be used to evaluate progress toward meeting the 2030 water conservation goals at county and regional levels.
Open Water Data website
Visit the Open Water Data website for a wealth of data including the latest water use numbers, interactive apps, maps and data visualizations. The site provides access to water data produced and maintained by the division that is useful for planning purposes.
The website features three primary data categories: Municipal & Industrial Water Use, Water-Related Land Use, and Water Budget. Various data can be explored and downloaded in many formats. Many are summarized by state, county, basin or water supplier boundaries. A gallery of online maps as well as resources from outside entities is also available.
Water use reporting by water districts
The four largest water conservancy districts in Utah, collectively known as the Prepare60 Center, will be reporting consumptive water use annually for Class 1 (Salt Lake) and Class 2 (Weber, Davis, Utah and Washington) counties. Class 1 and 2 counties have a population of 175,000 or more. Consumptive water use only reports the water consumed by customers; any water delivered to customers that is returned to the system isn’t counted. GPCD and consumptive use figures are not comparable.
SB 119, passed in the 2023 general legislative session, requires the division to designate which water conservancy district will determine a consumptive use number for each county. The division made the following designations in accordance with criteria specified in Utah Code 73-5-8.5(3)(a):
- Central Utah Water Conservancy District for Utah County
- Jordan Valley Water Conservancy District for Salt Lake County
- Washington County Water Conservancy District for Washington County
- Weber Basin Water Conservancy District for Weber and Davis counties
Each water conservancy district must develop a process for determining consumptive water use. Details regarding the consumptive use determination will be available from the water conservancy districts. Consumptive water use numbers are required to be reported to the Division of Water Rights.